Wins and Losses by Salesperson
The Wins and Losses by Salesperson report shows a list of won and lost opportunities for a specific salesperson between two date parameters.
Parameters
- User - This lets you choose the salesperson to show in the report.
- Sales grouping - This filters by the selected sales groupings. All groupings are selected by default.
- Start / End date - This filters the data between the two dates. They default to show the contract year to date.
Layout
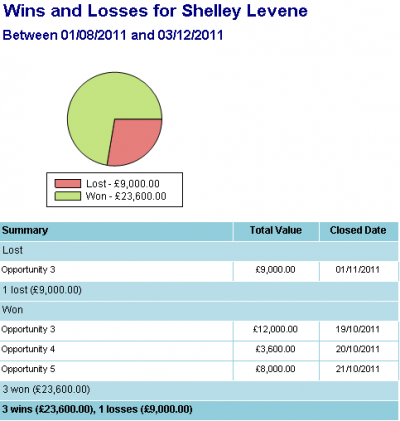
The report shows a pie chart at the top showing the proportion and number of wins to losses in the timeframe. The table below the chart lists the wins and losses, along with their total value and the date they were closed.
Won and lost opportunities are determined by the weighting percentage of the opportunity, with won items having a close date and weighting of 100% and lost items having a close date and a weighting of 0%.
Clicking on an opportunity will drill down to the Pipeline Item Summary report.